Olivia Berger · 8 September 2026
Mapping the Economic Ripple Effects of Waterfront Revitalization Initiatives
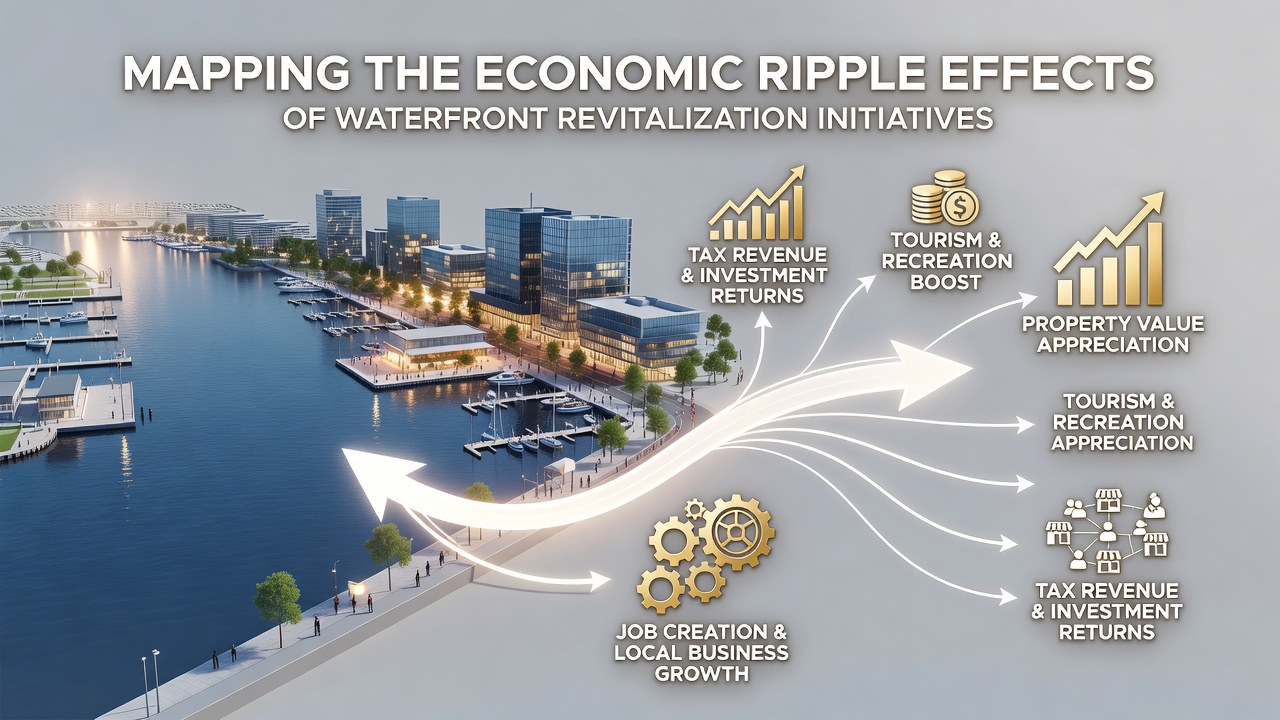
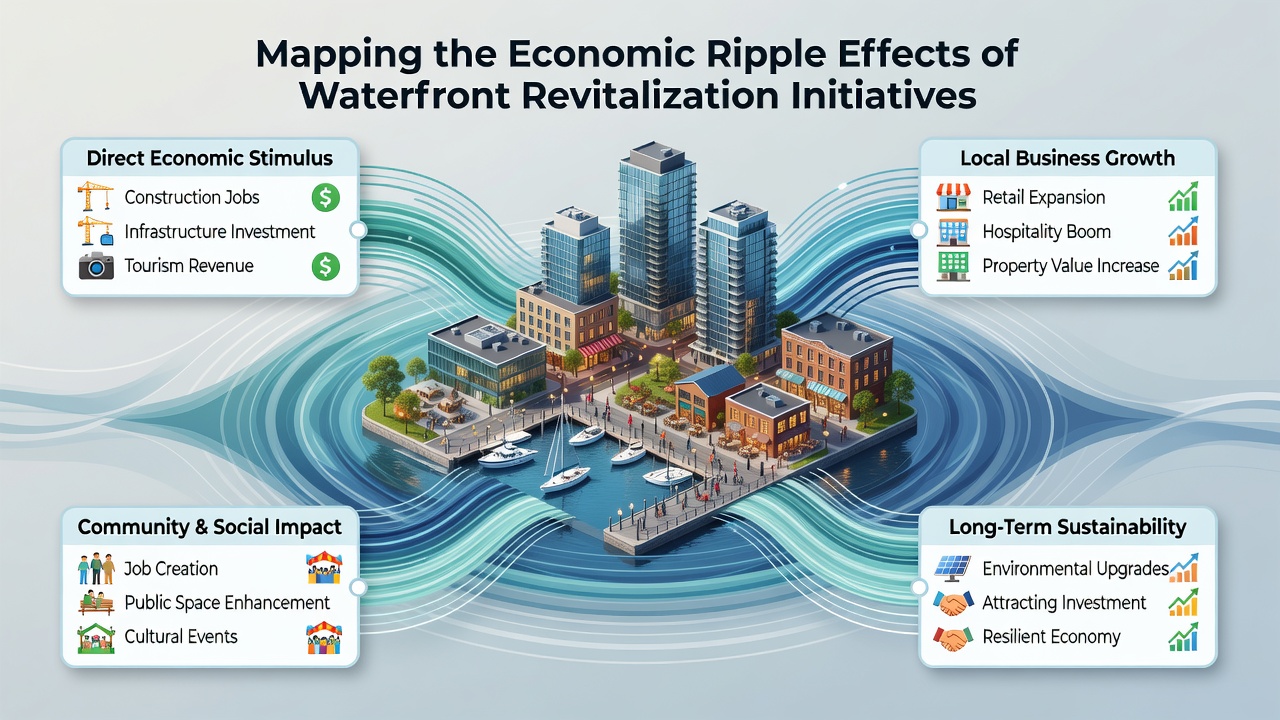
Waterfront revitalization initiatives reshape urban economies through interconnected channels that extend far beyond initial construction spending, and researchers track these patterns by following how public and private investments generate successive layers of activity in surrounding regions. Direct expenditures on infrastructure, parks, and mixed-use buildings create immediate jobs in construction and related trades, while indirect effects emerge as suppliers expand operations to meet new demand and induced spending occurs when workers spend earnings locally on housing, retail, and services.
Tracing Multiplier Effects Across Sectors
Economists apply input-output models to quantify these chains, and data from multiple completed projects show employment multipliers ranging from 1.8 to 2.7 additional positions for every direct construction role, depending on regional supply chains and wage levels. Property values typically rise within a one-kilometer radius of completed sites, which increases municipal tax revenues and supports further public improvements without raising rates. Tourism spending follows similar patterns, with visitor counts climbing steadily after new promenades, marinas, and cultural venues open to the public.
One analysis of European waterfront districts completed between 2015 and 2022 found that retail and hospitality sectors captured roughly 35 percent of total induced economic activity, while logistics and professional services absorbed another 28 percent. These distributions vary by city size and pre-existing industry mix, yet the overall pattern remains consistent across temperate and subtropical climates alike.
Measurement Approaches Used by Analysts
Analysts combine satellite imagery, transaction-level credit card data, and longitudinal employment records to isolate project-driven changes from broader market trends. Geographic information systems map spending clusters around project boundaries, revealing that 60 to 75 percent of new business formation occurs within 800 meters of completed waterfront segments during the first five years. Econometric techniques such as difference-in-differences comparisons then test whether observed gains exceed those in matched control zones that lack similar investments.
September 2026 data releases from several national statistical agencies are expected to refine these estimates further, particularly for projects that incorporated climate-resilient design features. Early previews indicate stronger retention of small business tenants when flood-mitigation elements form part of the original master plan.
Regional Case Patterns
Cities along major river systems and coastal harbors provide repeated examples of how timing and governance influence outcomes. In North American ports that phased investments over eight to ten years, cumulative GDP contributions reached 1.4 times the original public outlay within a decade, whereas shorter timelines produced more modest ratios closer to 1.1. European examples emphasize integration with regional transport networks, which amplifies visitor flows and reduces leakage of spending to distant suppliers.
Australian and Canadian port authorities report parallel results when brownfield remediation precedes commercial redevelopment, with remediation costs offset within four to six years through higher land values and new lease income. These cases illustrate that upfront environmental work expands the pool of viable private partners and shortens the interval before positive fiscal returns appear.
External Linkages and Leakage Considerations
Leakage occurs when construction materials or specialized labor come from outside the immediate region, reducing local multipliers. Studies that incorporate supply-chain mapping show leakage rates between 22 and 38 percent for waterfront projects, with lower figures when procurement policies favor regional firms. OECD urban development reports document how targeted supplier development programs can compress these percentages by 10 points or more.
Conversely, well-connected waterfront districts attract headquarters functions and technology firms seeking amenity-rich locations, which introduces new export-oriented activity and further widens the economic footprint. Researchers note that each additional corporate tenant above a certain employment threshold generates measurable increases in demand for nearby professional services and housing.
Conclusion
Mapping the ripple effects of waterfront revitalization requires sustained data collection across multiple economic layers and geographic scales. Evidence compiled from completed initiatives demonstrates measurable gains in employment, tax base expansion, and visitor expenditure, although the magnitude depends on project duration, environmental remediation scope, and integration with regional supply networks. Continued refinement of analytical tools, supported by forthcoming 2026 datasets, will allow planners to anticipate these dynamics with greater precision and allocate resources accordingly.